MCMC Diagnostics and Visualization
When fitting a model using the MCMC method (via emcee), the application provides a set of dedicated plots and diagnostics tools to analyze the posterior distributions of the parameters.
1. MCMC Fit Plot
- Displays the median fit curve obtained from the posterior samples.
- A 99% confidence band (credible interval) is shown around the curve.
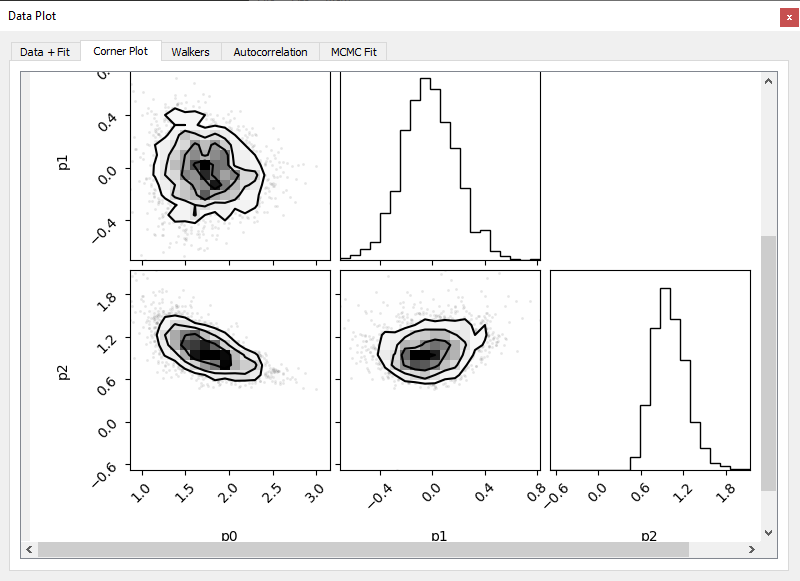
2. Corner Plot
- Shows the marginal and joint distributions of all model parameters.
- Each subplot provides histograms (diagonal) and 2D scatter plots (off-diagonal).
- Useful to assess parameter correlations, asymmetry.
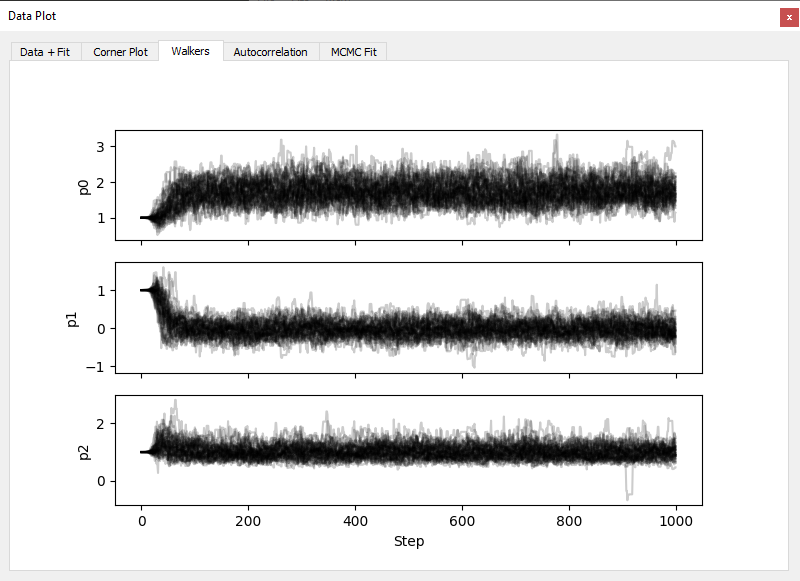
3. Walkers Plot
- Plots the value of each parameter across sampling steps for all walkers.
- Helps diagnose convergence and detect sampling issues (e.g., stuck walkers).
- Walkers should appear well-mixed and stable after the burn-in period.
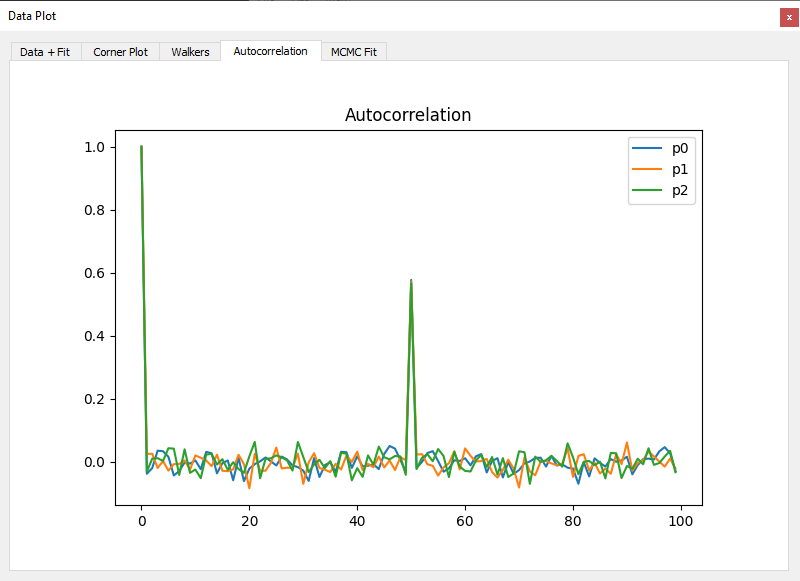
4. Autocorrelation Plot
- Displays the autocorrelation time of each parameter.
- Allows evaluation of sampling efficiency and helps determine appropriate
thinorburnsettings.
Notes
- All MCMC diagnostics are computed after discarding the burn-in period.
- If convergence is poor, consider increasing the number of walkers or steps.
- You can export posterior samples or corner plots from the toolbar menu.